Details about DataAnalysis

  • Released
  • Updated
  • iOS Version
  • Age Rating
  • Size
  • Devices
  • Languages
  • June 20, 2010
  • September 29, 2024
  • 14.0+
  • 4+
  • 26.47MB
  • iPad
  • English

Features

Developer of DataAnalysis

🙌105
Ratings
🗣❌ unsupported
Your locale
🖼️Download
Icons↘︎

Version History of DataAnalysis

4.11

March 31, 2021

Fixed bug related to migration to Version 4 data file format from all previous versions.

4.1

March 23, 2021

Fixed issue related to using European number formatting as well as a number of minor bug fixes.

4.0

January 14, 2021

Version 4.0 of the DataAnalysis is a major update of the App incorporating may of the latest iPad OS features. DataAnalysis now uses the iPad OS Document Browser as the major interface for the user to interaction with existing data files in native, CSV or TXT format. The Document Browser provides options to share, duplicate, rename, move, delete, create subfolders and create new documents. Furthermore, the user can access files stored on iCloud or other cloud storage locations such as Dropbox, Box and OneDrive. DataAnalysis now can perform error analysis in a number of ways. For example, if you have a series of X,Y pairs, in which groups have the same X value, then the DataAnalysis can average each group and calculate standard deviations. These standard deviations can be used to draw error bars on the graph. Other modes to add error bars are also available. The standard curve analysis has been rewritten to simplify use. Output of data in a variety of formats is now much easier by incorporating the iPadOS Share Sheet. You can use the Share Sheet to share, save or print the raw data in CSV or TXT files. The Share Sheet can also be used for sharing, saving or printing the graph, data analysis, or standard curve analysis. Other options are also available from the Share Sheet depending upon what other Apps are installed on the iPad. For example, if the Apps for cloud storage providers such as Box, Dropbox, OneDrive, etc are installed, the Share Sheet can be used to save the raw data, graphs and results to these locations. Data entry into the spreadsheet can now be done using the Apple Pencil. New Getting Started and Error Analysis tutorials also have been added.

More

3.5.2

April 12, 2020

Version 3.5.2 of the DataAnalysis App has a number of important improvements and bug fixes. This version has been compiled with the latest development software (Version 13.3). The DataAnalysis App will now work correctly on all sizes of iPads from the Mini to the Pro 11 and 12.9 sizes. DataAnalysis native format data files are now compatible with the new iPhone version (DataAnalysisLite).

More

3.4.5

February 20, 2018

Version 3.4.5 of the DataAnalysis App has a number of important bug fixes. In addition, DataAnalysis native format data files are now compatible with the new iPhone version call DataAnalysisLite.

More

3.4.3

March 19, 2017

Version 3.4 of the DataAnalysis App has an important new feature, locally weighted scatterplot smoothing. In addition to the various options to fit data to specific mathematical functions, this version of DataAnalysis has added the ability to fit data without the need to specify a mathematical function, by using Lowess Regression (LOcal Weighted regrESSion). Not only does Lowess Regression not require a mathematical function, but also does not require parameters (non-parametric). This fitting method is especially useful for data that does not conform to a specific mathematical model or the mathematical model is unknown. Lowess Regression and related fitting methods are used extensively to fit everything from election polling to astrophysics data, where the data have a large degree of scatter. For more details see the DataAnalysis online User Guide (http://www.scidatadataanalysis.com/DGsite/ug_lowessRegression.html). In addition, a number of bugs have been fixed related to the ability to email data and results as well as save the graph to Photos. Finally, this version of DataAnalysis has been updated with new Dropbox features (API V2).

More

3.4.2

November 7, 2016

Version 3.4 of the DataAnalysis App has an important new feature, locally weighted scatterplot smoothing. In addition to the various options to fit data to specific mathematical functions, this version of DataAnalysis has added the ability to fit data without the need to specify a mathematical function, by using Lowess Regression (LOcal Weighted regrESSion). Not only does Lowess Regression not require a mathematical function, but also does not require parameters (non-parametric). This fitting method is especially useful for data that does not conform to a specific mathematical model or the mathematical model is unknown. Lowess Regression and related fitting methods are used extensively to fit everything from election polling to astrophysics data, where the data have a large degree of scatter. For more details see the DataAnalysis online User Guide (http://www.scidatadataanalysis.com/DGsite/ug_lowessRegression.html). In addition, a number of bugs have been fixed including the ability to upload data and results to Dropbox.

More

3.4.1

October 24, 2016

Version 3.4 of the DataAnalysis App has an important new feature, locally weighted scatterplot smoothing. In addition to the various options to fit data to specific mathematical functions, this version of DataAnalysis has added the ability to fit data without the need to specify a mathematical function, by using Lowess Regression (LOcal Weighted regrESSion). Not only does Lowess Regression not require a mathematical function, but also does not require parameters (non-parametric). This fitting method is especially useful for data that does not conform to a specific mathematical model or the mathematical model is unknown. Lowess Regression and related fitting methods are used extensively to fit everything from election polling to astrophysics data, where the data have a large degree of scatter. For more details see the DataAnalysis online User Guide (http://www.scidatadataanalysis.com/DGsite/ug_lowessRegression.html). In addition, a number of bugs have been fixed related to the ability to email data and results.

More

3.4.0

October 23, 2016

Version 3.4.0 of the DataAnalysis App has an important new feature, locally weighted scatterplot smoothing. In addition to the various options to fit data to specific mathematical functions, this version of DataAnalysis has added the ability to fit data without the need to specify a mathematical function, by using Lowess Regression (LOcal Weighted regrESSion). Not only does Lowess Regression not require a mathematical function, but also does not require parameters (non-parametric). This fitting method is especially useful for data that does not conform to a specific mathematical model or the mathematical model is unknown. Lowess Regression and related fitting methods are used extensively to fit everything from election polling to astrophysics data, where the data have a large degree of scatter. For more details see the DataAnalysis online User Guide (http://www.scidatadataanalysis.com/DGsite/ug_lowessRegression.html). In addition, a number of bugs have been fixed related to the ability to email data and results.

More

3.3.0

September 19, 2016

This is a minor upgrade with one new feature and bug fixes. We have added two new symbols, + and x, which can be used in the graphs. In addition, we have also corrected problems with entry of data into the spreadsheet.

More

Price History of DataAnalysis

Description of DataAnalysis

DataAnalysis is a general purpose iPad App for the plotting and fitting of all types of data that can be formulated as x, y pairs. The program can be easily used by both students and professionals. It is particularly useful for quick analyses of various types of data by curve fitting, value prediction via a standard curve, and analysis of kinetic data including enzyme kinetics. Data can be entered directly via the keyboard or imported from a text file (.txt), or a comma separated value file (.csv). In addition, data can be pasted from the clipboard. After data entry the user has the option to average, baseline correct, and/or normalize the data before plotting and fitting. Plotting of the data is as simple as pressing the Plot button. The axes are autoscaled and the graph is immediately ready to add to a document or presentation. The user has a variety of options to customize the graph by altering the axes, axes labels, graph title, and changing the symbol, its size and color. 
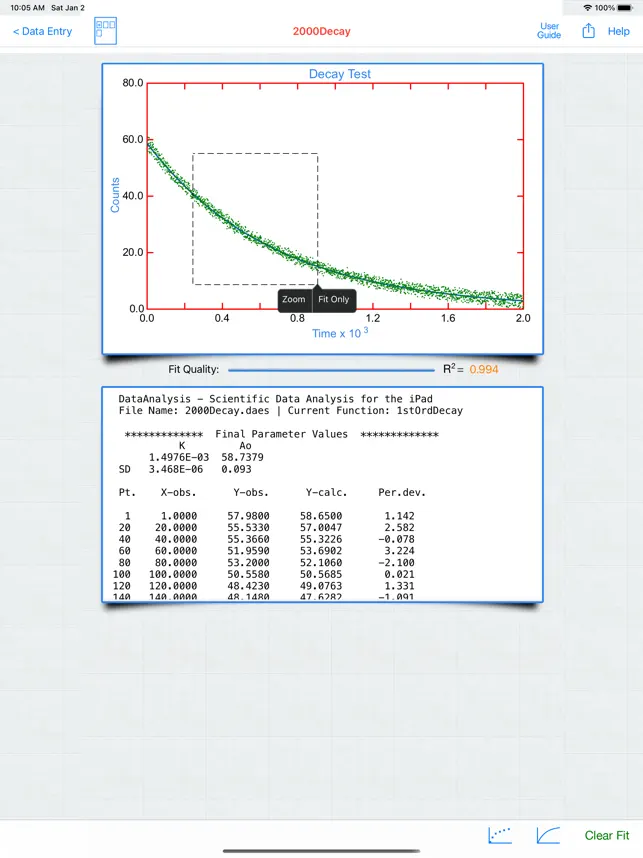
Using touch and drag the user can create a selection box allowing the creation of a data subset. Once the data subset has been selected the user has two options: (1) To zoom in on the selected data. Any fitting done in this mode is global (e.g. uses all the data). (2) To zoom and perform a fitting only on the selected subset of the data. The data can be fit to a variety of mathematical equations by non-linear regression including simple functions such as linear, 2nd and 3th order polynomials, power, exponential, and log functions. Data can also be fit to more complex equations for such processes as radioactive decay, enzyme kinetics, 1st and 2nd order chemical reactions, as well as gaussian, logistics and surge functions. The fit can be overlaid on the data with different line widths, types and thicknesses. 
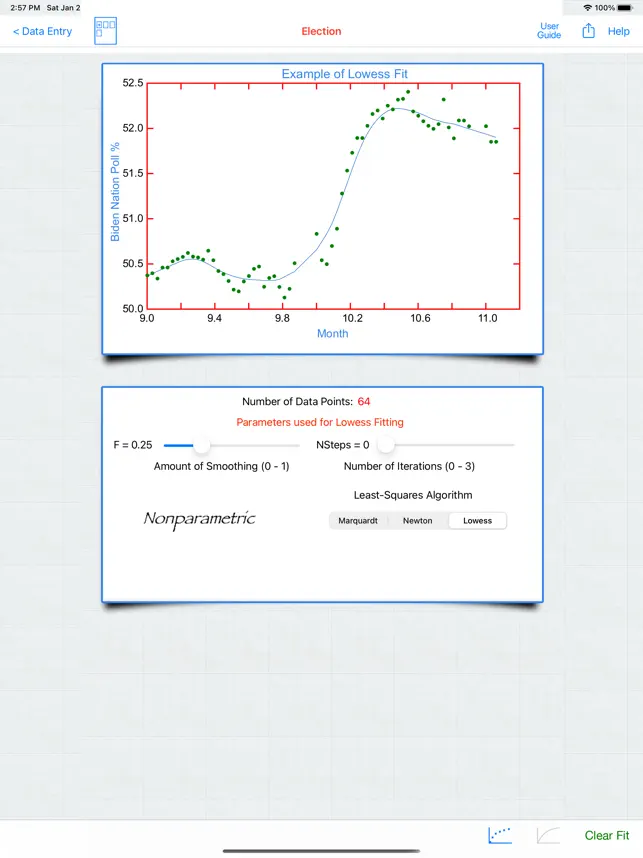
Lowess Regression (LOcal Weighted regrESSion) can also be used to fit data without the need to specify a mathematical function. Not only does Lowess Regression not require a mathematical function, but also does not require parameters (non-parametric). This fitting method is used extensively to fit everything from election polling to astrophysics data, where the data have a large degree of scatter. For many analytical situations, the data fit can be used as a standard curve to determine the value of unknowns. This analytical procedure is completely automated within DataAnalysis. 
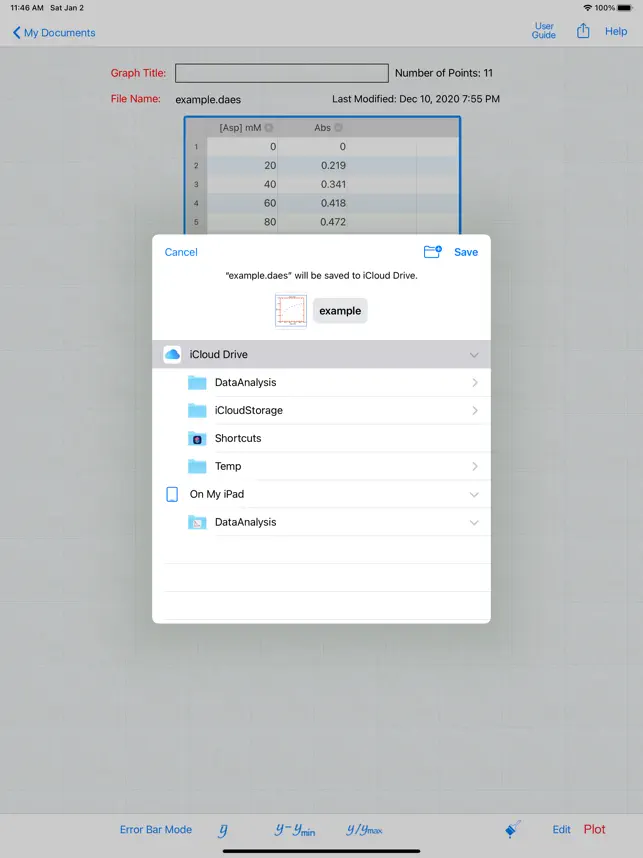
The program output, graphics and text, can be copied, emailed, or uploaded to cloud storage such as iCloud, Dropbox, Box and OneDrive in a variety of formats including PDF, PNG, CSV and TXT. The graphics in PDF format can be edited with programs like Adobe Illustrator™ and AutoDesk Graphic™ as objects. DataAnalysis also supports multitasking and printing of input data as well as all forms of output. DataAnalysis has built in tool tips, a comprehensive web based User Guide and videos tutorials all available via the Help Menu.
Show less

DataAnalysis: FAQ

Is DataAnalysis software compatible with iPad devices?

Yes, DataAnalysis is iPad-friendly.

Who is the developer of the DataAnalysis app?

The DataAnalysis app was launched by Evan Kantrowitz.

What is the minimum iOS version needed for DataAnalysis to work?

The DataAnalysis app requires iOS 14.0 or later.

What user rating does the app have?

The DataAnalysis app has a consumer rating of 4.1 and gets a lot of positive feedback.

What genre is the DataAnalysis app?

The App Category Of Dataanalysis Is Productivity.

What is the newest version of DataAnalysis?

The latest version of the DataAnalysis app is 4.11.

When did the new DataAnalysis update come out?

The latest DataAnalysis update was released on September 29, 2024.

When did DataAnalysis come out?

The DataAnalysis app originally came out on February 5, 2023.

What content advisory rating does DataAnalysis have?

DataAnalysis doesn’t contain potentially objectionable material and is rated Evan Kantrowitz.

What are the languages supported by the DataAnalysis app?

Currently, DataAnalysis supports English.

Does Apple Arcade provide access to DataAnalysis for its subscribers?

No, DataAnalysis is not featured on Apple Arcade.

Can users make in-app purchases in DataAnalysis?

Unfortunately, users cannot make in-app purchases within DataAnalysis.

Is DataAnalysis designed for Apple Vision Pro integration?

Sorry, DataAnalysis is not designed for integration with Apple Vision Pro.

Does DataAnalysis incorporate ads within the app?

No, DataAnalysis does not incorporate ads within the app.

Screenshot of DataAnalysis

DataAnalysis video #1 for iPad
DataAnalysis video #2 for iPad
DataAnalysis screenshot #3 for iPad
DataAnalysis screenshot #4 for iPad
DataAnalysis screenshot #5 for iPad
DataAnalysis screenshot #6 for iPad
DataAnalysis screenshot #7 for iPad
DataAnalysis screenshot #8 for iPad
DataAnalysis screenshot #9 for iPad
DataAnalysis screenshot #10 for iPad
DataAnalysis screenshot #11 for iPad
DataAnalysis screenshot #12 for iPad
ipad

Alternatives to DataAnalysis

More Applications by Evan Kantrowitz

Reviews of DataAnalysis

Leave a Review DataAnalysis
  • Waste

    I was happy to finally find an app to conduct data analysis . Unfortunately the app will not let me import .csv files only the app specified format . Very disappointing
  • Paste from clipboard???

    Seriously need to add an import function inside the app for CSV files at the very least. Forcing folks to use Dropbox or the mail app to take advantage of that functionality is ridiculous and takes away from what you can really do with the app....
  • Works as Described

    The input and output are not very fancy but if you need a simple x-y plot, this is it. It produces a nice graph and will fit a polynomial line (via regression) of your choice together with relevant statistics.

    My first use was to plot some blood sugar readings that I take daily. It did an excellent job.

    Update:
    I am giving it another star.
    Show less